Skip to Content

Real-time monitoring of NK cell activity

Download the Application Note in Text-Friendly (.MD) Format

Application Note: Real-time monitoring of NK cell activity: A novel approach using Celloger® Pro and optimized staining reagents

This Application Note describes a real-time imaging method to quantify NK-92 cell cytotoxicity against U-2OS target cells using the Celloger® Pro live cell analysis system. Accurate assessment of NK cell cytotoxicity is critical for advancing NK cell therapy and CAR-NK development, yet conventional assays such as LDH, MTT, or 51Cr release are limited to endpoint measurements and can be compromised by dye leakage.

To address this challenge, Yamato Scientific America highlights a live cell analysis workflow combining Celloger® Pro with optimized fluorescent staining reagents. In comparative NK cell killing assays, Calcein-AM showed rapid leakage, artificially inflating red-to-green fluorescence ratios and overestimating cell death. In contrast, CellTracker™ CMFDA demonstrated superior intracellular retention, enabling stable real-time imaging over 24 hours and more accurate quantification of NK-92 cell cytotoxicity across multiple effector-to-target ratios.

The key result: improved dye stability directly enhances assay reliability, reproducibility, and single-cell resolution monitoring of immune-mediated cytotoxicity. This method provides a powerful alternative to traditional endpoint assays. Download the full Application Note to explore the detailed protocol and comprehensive data set.


Introduction

Natural Killer (NK) cells are a crucial part of the innate immune system, recognized for their inherent ability to identify and eliminate malignant or virus-infected cells without prior sensitization.1 Evaluating the efficacy of NK cell-based therapies is essential in preclinical studies, where NK cell killing assays play a central role. These assays measure NK cell cytotoxicity by co-culturing NK cells with fluorescently labeled target cells, with the degree of target cell lysis serving as an indicator of NK cell killing activity. Flow cytometry or fluorescence microscopy is commonly used to quantify these results, allowing for a precise evaluation of NK cell function, which is vital for optimizing and validating NK cell products.

Recent advancements in NK cell therapy, particularly with Chimeric Antigen Receptor NK (CAR-NK) cells engineered to better target and destroy tumor cells, have driven a growing need for more accurate assays in cancer treatment. However, the accuracy of NK cell killing assays is often compromised by technical challenges due to the rapid leakage of Calcein-AM, a commonly used dye for staining target cells. Calcein AM is widely recognized for its ability to fluorescently label live cells with minimal impact on their function, making it a standard tool in various analytical methods including microscopy and flow cytometry. However, significant leakage of Calcein-AM has been reported in certain cell types, raising concerns about its reliability.

In our experiments, similar issues were observed when Calcein-AM was used to stain target cells during NK cell killing assays. The leakage of Calcein-AM reduces the overall cell count, regardless of NK cell activity, making it challenging to accurately assess NK cell-mediated target cell death. To address this issue, using CellTracker CMFDA, a green fluorescent dye with less leakage and enhanced intracellular retention compared to Calcein-AM. This allowed for more accurate monitoring and analysis of NK cell-mediated cytotoxicity.

In this application note, we present a method to analyze NK cell cytotoxicity in real time with improved accuracy and efficiency. This method uses the automated live cell imaging system Celloger® Pro along with optimized staining reagents.


Materials and Methods

In this study, U-2OS cells were used as target cells and prepared under three different conditions: (1) stably expressing EGFP-tagged H2B, (2) stained with 2 μM Calcein-AM (Invitrogen, C1430), and (3) stained with 3 μM CellTracker™ Green CMFDA Dye (Invitrogen, C2925). For cells requiring dye staining, they were incubated at 37°C for 30 minutes in a working solution of the staining reagents in serum-free media, followed by washing. U-2OS cells stably expressing EGFP-tagged H2B did not require additional fluorescent dye staining. After preparation, the target cells were seeded in 48-well plates at a density of 3 x 10⁴cells per well and co-cultured with NK-92 cells (effector cells) at varying effector-to-target (E:T) ratios (5:1, 10:1, 20:1). Cell viability was assessed by adding 4 μM Ethidium homodimer (EthD-1) (Sigma, 46043-1MG-F), and images were captured at 1-hour intervals over a 24-hour period using a Celloger® Pro with a 4X objective lens. The experimental results were analyzed using Celloger® analysis software, focusing on overall green and red fluorescence intensities to evaluate NK cell cytotoxicity.


Results

NK cell cytotoxicity was analyzed using NK-92 cells as effector cells and U-2OS cells as target cells. To simulate cancer cell metastasis, U-2OS cells – naturally adherent cells with solid tumor characteristics – were detached and suspended before co-culture with NK-92 cells. Using suspended U-2OS cells to study NK cell mediated cytotoxicity, we aimed to gain insights into the mechanisms by which NK cells target and destroy metastatic cancer cells.

First, we performed an NK cell killing assay with U-2OS cells stably expressing a green fluorescent protein (GFP:H2B) bound to DNA. Real-time observation of NK-92 cell-mediated cytotoxicity against U-2OS cells was conducted using Celloger® Pro system with a 4X lens over 24 hours. As the effector-to-target (E:T) cell ratio increased, we observed a rise in red fluorescence intensity, indicating cell death, along with a decrease in green fluorescence intensity. Additionally, the size of the clusters formed by NK-92 and U-2OS cells increased (Fig. 1A). This suggests that higher effector cell concentrations lead to increased interactions with target cells, which results in both larger clusters and more cell destruction. To quantify NK cell-mediated target cell death, we measured red and green fluorescence intensities using the Celloger analysis software and calculated the red-to-green fluorescence ratio. The results confirmed that target cell death increased proportionally with the E:T cell ratio (Fig. 1B).

Using stable cell lines like U-2OS cells expressing GFP provides highly accurate results for long-term monitoring but the process of generating these cell lines has several drawbacks. It is time-consuming and requires significant effort as it involves genetic modification with multiple rounds of selection to ensure stable expression. These factors make it inefficient for high-throughput or repeated experiments. Additionally, the resources and expertise required to create and maintain stable cell lines can limit their practicality, especially when quick results are needed. Due to these limitations, we explored an alternative approach using live cell staining dyes since they enable faster experimental setup while still providing reliable results in NK cell killing assays.

We conducted experiments using two staining reagents, Calcein-AM and CellTracker CMFDA, to label the target U-2OS cells while varying the NK cell ratios in both cases. As NK cell ratios increased, we observed similar results to the GFP-expressing cell line: increased red fluorescence intensity, decreased green fluorescence intensity, and formation of larger cell clusters (Fig. 2A, 2B). However, the fluorescence intensity ratio in Calcein-AM-stained U-2OS cells increased disproportionately, particularly at an E:T cell ratio of 10:1 (Fig. 2C). This was due to the rapid leakage of Calcein-AM from the labeled cells, which caused a significant reduction in the number of live-labeled cells over time and led to an overestimated cell death rate (Fig. 3A, 3B). This rapid dye leakage compromised the accuracy of long-term tracking and quantification of target cell viability, making it difficult to consistently assess cell death.

In contrast, CellTracker CMFDA provided superior intracellular retention compared to Calcein-AM, with green fluorescence persisting for over 12 hours (Fig. 3A, 3B). Although some minor leakage was observed, it was significantly less than that of Calcein-AM. This stability enabled more precise long-term tracking of NK cell cytotoxicity. Additionally, the artificial elevation of the red-to-green fluorescence ratio was noticeably reduced, making CellTracker CMFDA a more reliable option for these assays (Fig. 2C).

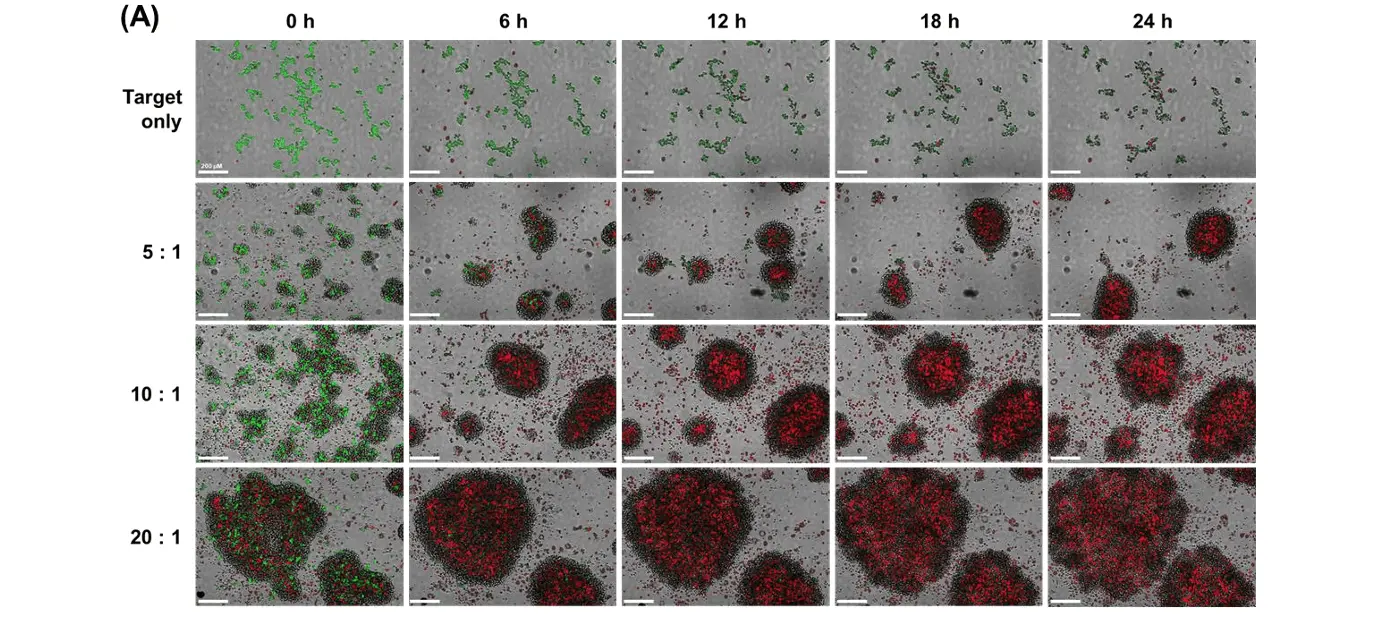
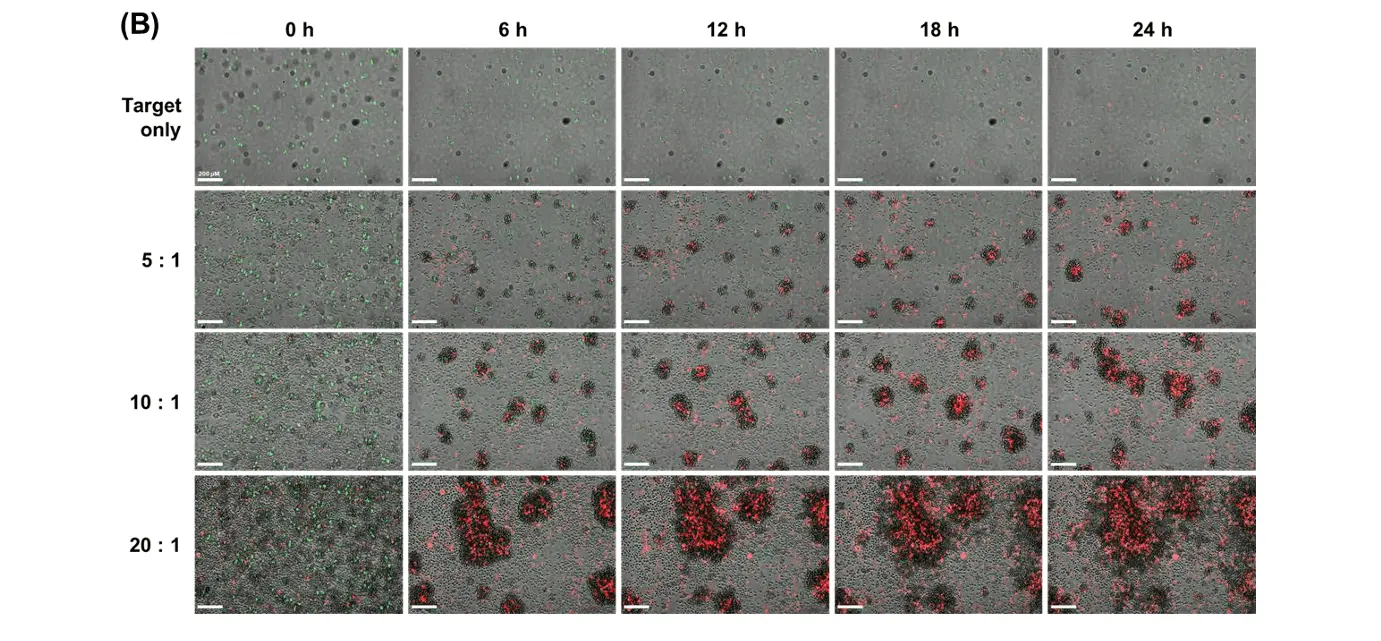
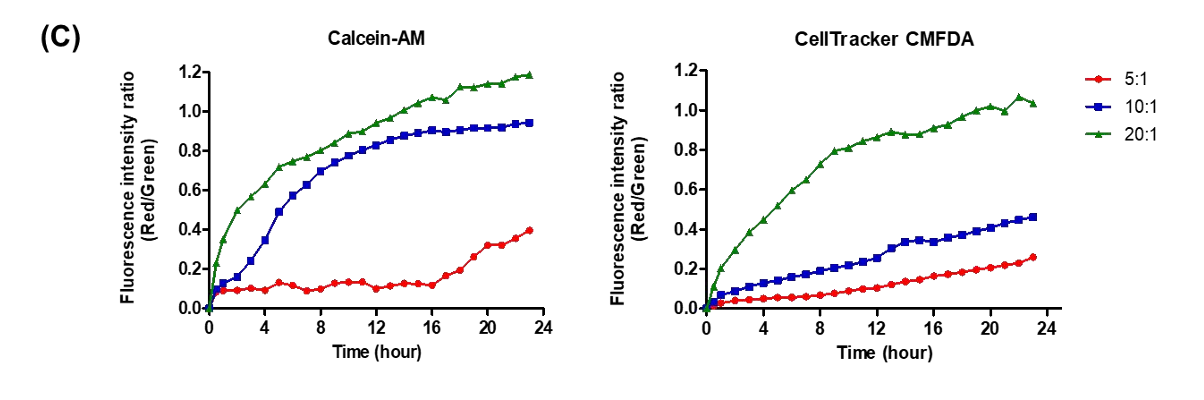
Figure 2. NK-92 killing assay with U-2OS cells stained with live cell staining dyes

((A, B) NK-92 cells were co-cultured with U-2OS cells stained with either Calcein-AM (A) or CellTracker CMFDA (B) at different effector-to-target (E:T) ratios of 5:1, 10:1, and 20:1. Images were captured every hour over a 24 hour period using a Celloger® Pro with a 4X lens. (C) The graph shows the fluorescence intensity ratio (red/green) of U-2OS cells stained with Calcein-AM or CellTracker CMFDA over a 24-hour period, comparing the three different E:T ratios: 5:1, 10:1, and 20:1.


Conclusion

In this study, we explored an alternative approach to traditional NK cell-mediated cytotoxicity assays, which have historically relied on methods such as radioactive chromium (51Cr) labeling or nonradioactive techniques like LDH and MTT-based colorimetric/enzymatic assays. While these conventional methods are well established, they are limited by their ability to measure cytotoxicity at a single time point and by the risks associated with handling radioactive materials. To address these limitations, we utilized fluorescent dyes to label target cells and used the Celloger® Pro to monitor target cell lysis in real-time by analyzing the red-to green fluorescence intensity ratio.

Our findings demonstrated that the Celloger® Pro offers several advantages over traditional methods such as LDH or MTT assays, including real-time monitoring capabilities and the ability to directly observe. This approach provides a more precise understanding of cellular changes at the individual cell level, capturing both morphological alterations and cell death processes, thereby enhancing the accuracy and depth of cytotoxicity studies.

Specifically, our experiments showed that U-2OS cells stained with CellTracker CMFDA dye exhibited higher retention within cells compared to Calcein-AM, thereby minimizing inaccuracies caused by spontaneous dye leakage. Moreover, using CellTracker CMFDA provided greater flexibility compared to generating stable cell lines expressing GFP, avoiding the time-consuming and technically challenging processes associated with stable cell line generation. This flexibility makes the CellTracker CMFDA dye system particularly advantageous for a wide range of experimental setups.

However, it is important to note that the results of NK cell killing assays can vary depending on the type of target cells used. Therefore, it is crucial for users to optimize both the selection of the staining dye and its concentration to align with the specific characteristics of their target cells, ensuring the most accurate and reliable results.


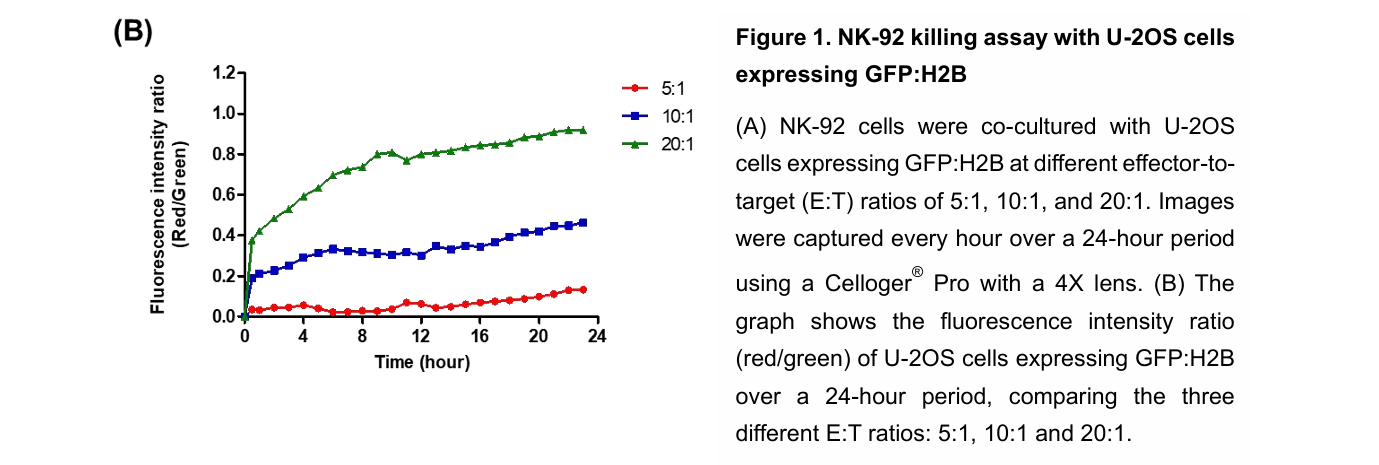
NK cell cytotoxicity can be monitored in real time by labeling target cells with fluorescent dyes and tracking changes in red and green fluorescence over time. In this study, the Celloger® Pro system captured images every hour for 24 hours and quantified cytotoxicity using the red-to-green fluorescence intensity ratio. This approach enables continuous observation of cell death dynamics rather than a single endpoint measurement.

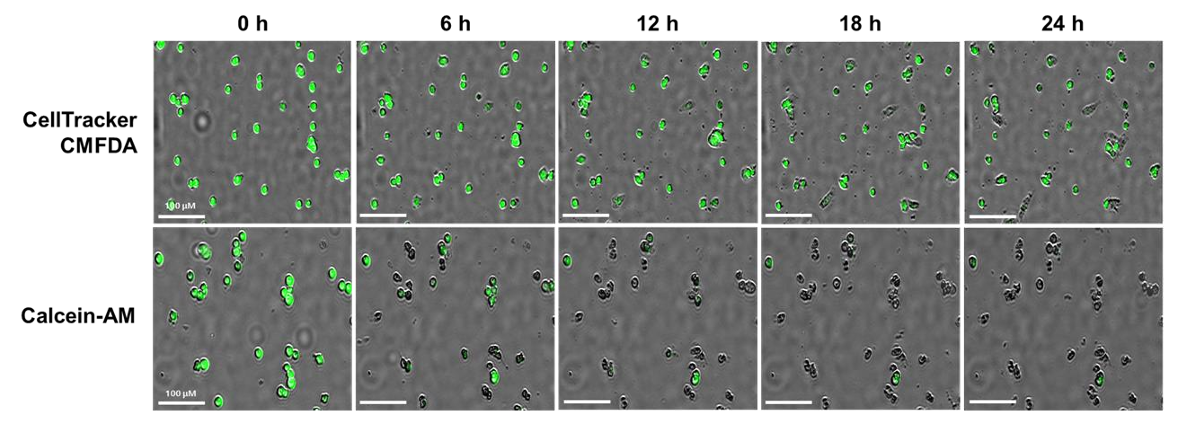
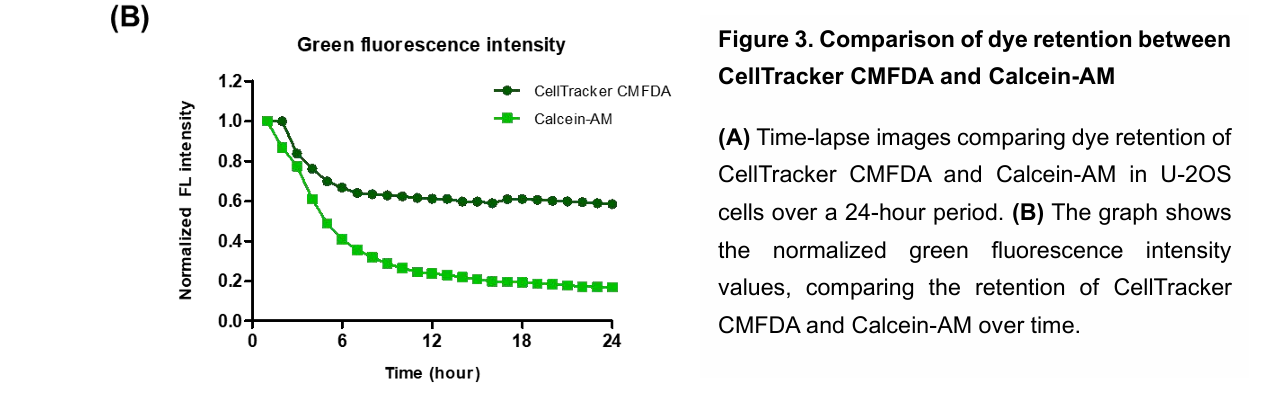
Calcein-AM can rapidly leak from labeled target cells, reducing green fluorescence intensity over time. This leakage artificially increases the red-to-green fluorescence ratio, leading to overestimation of NK cell-mediated cytotoxicity. As a result, long-term tracking and accurate quantification of target cell viability become difficult.

CellTracker CMFDA provides superior intracellular retention compared to Calcein-AM, with green fluorescence persisting for over 12 hours. This improved stability reduces artificial elevation of cytotoxicity measurements caused by dye leakage. As a result, it enables more accurate and reliable long-term monitoring of NK cell activity.

Celloger® Pro enables automated, real-time live-cell imaging and quantitative fluorescence analysis. By capturing hourly images and calculating the red-to-green fluorescence ratio, it provides dynamic insights into both morphological changes and cell death processes. This enhances accuracy compared to traditional LDH or MTT endpoint assays.

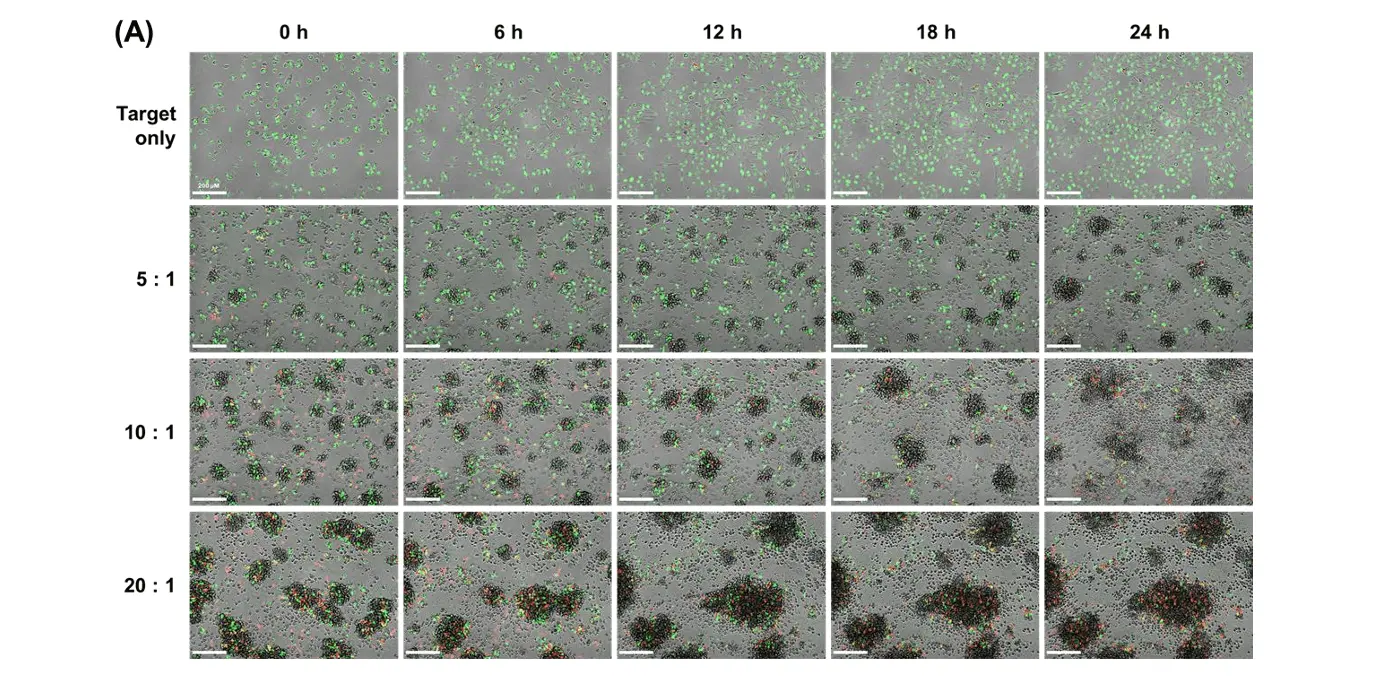
The study evaluated E:T ratios of 5:1, 10:1, and 20:1 using NK-92 cells as effectors and U-2OS cells as targets. Higher E:T ratios resulted in increased red fluorescence intensity, decreased green fluorescence, and larger cell clusters. These findings confirmed that cytotoxicity increased proportionally with effector cell concentration.  

U-2OS cells, which are naturally adherent solid tumor cells, were detached and suspended before co-culture with NK-92 cells. This setup simulated metastatic cancer conditions. It allowed researchers to study how NK cells interact with and destroy suspended tumor cells.

NK cell-mediated cytotoxicity was monitored over a 24-hour period. Images were captured at 1-hour intervals using the Celloger® Pro with a 4X objective lens. This continuous imaging enabled detailed time-lapse analysis of cell death progression.  

No, generating stable GFP-expressing cell lines is not required. While stable lines provide accurate long-term monitoring, they are time-consuming and labor-intensive to create. Using live-cell dyes such as CellTracker CMFDA offers a faster and more flexible alternative for many experimental setups.

Target cell death is quantified by measuring red fluorescence from Ethidium homodimer (EthD-1) and green fluorescence from labeled live cells. The red-to-green fluorescence intensity ratio is calculated using Celloger analysis software. An increase in this ratio correlates with increased NK cell cytotoxicity.  

The choice of staining dye should be optimized based on the specific target cell type and experimental conditions. Dye retention, leakage rate, and compatibility with long-term imaging are critical factors. Optimizing dye selection and concentration ensures accurate and reproducible cytotoxicity measurements.

Download the full Application Note PDF

to access the complete live-cell imaging workflow, optimized fluorescent staining protocol, comparative dye stability analysis, and quantitative real-time cytotoxicity data demonstrating accurate NK-92–mediated killing of U-2OS cells using the Celloger® Pro system.


An integrated live cell monitoring