Skip to Content

Observation of Mitosis

Download the Application Note in Text-Friendly (.MD) Format

Application Note: Observation of Mitosis Using Celloger® Mini plus

This Application Note demonstrates real-time imaging of HeLa cell mitosis using H2B-GFP nuclear labeling and nocodazole treatment with the Celloger® Mini Plus. Uncontrolled cell division is a hallmark of cancer, and evaluating anti-mitotic drug activity requires precise, continuous monitoring of chromosomal dynamics. Traditional endpoint assays often miss critical temporal events during mitosis. To address this challenge, Yamato Scientific America highlights the use of Celloger for automated live cell analysis and real-time imaging of H2B-GFP transfected HeLa cells exposed to the microtubule inhibitor nocodazole.

Using brightfield and green fluorescence channels, time-lapse imaging captured chromosome condensation, metaphase alignment, chromatid separation, and daughter cell formation in untreated controls. In contrast, nocodazole-treated cells exhibited mitotic arrest, failed chromatid segregation, and subsequent apoptosis. This approach provides clear visualization of nocodazole-induced mitotic arrest and nuclear fragmentation over a 24-hour period.

The study demonstrates that Celloger enables precise, automated tracking of mitotic progression and anti-mitotic drug effects, delivering actionable insights for cancer research and drug development workflows. Download the full application note to explore the detailed protocol and comprehensive data set.


Introduction

In the process of ‘cell cycle’, cells grow and divide into two genetically identical daughter cells. It is regulated by a complex signaling pathway which keeps cell homeostasis by regulating cell division and DNA duplication. On the other hand, because cancer cells grow and divide indefinitely out of cell cycle control, anti-mitotic drugs are used to suppress abnormal proliferation of cancer cells. In particular, Nocodazole is known to be a representative anti-mitotic drug for cancer treatment, and it has the characteristics of disturbing microtubule dynamics during cytoplasmic and nuclear division.

In the present study, we examined the anti-mitotic activity of nocodazole against cancer cell line by monitoring the cell division process. To this end, Hela cells were stably transfected with green fluorescent protein fused histone 2B (H2B-GFP), which visualizes the dynamics of chromosomal structure during cell cycle progression. And then, the cell division was monitored in real time after treating the cell with or without nocodazole using Celloger® Mini Plus, a live cell imaging device.


Method

HeLa cells transfected with H2B-GFP plasmid were seeded into a 24 well plate at 4 x 10⁴ cells/well. Cells were cultured with 10% Fetal bovine serum and Dulbecco’s Modified Eagle’s Medium to which 300 ug/mL G418 was added. After overnight culture to attach the cells, they were incubated with or without 62.5 nM of nocodazole, and real time imaging was conducted using Celloger® Mini Plus (Bright field & green fluorescence channel, 10X optics). Images were taken every 15 minutes for 24 hours.


Result

Brightfield and fluorescence time-lapse imaging of Hela cells transfected with green fluorescent protein fused H2B was performed to observe nuclear changes in mitosis. In the bright field image, the nuclear membrane was clearly visible at the beginning, then they gradually disappeared and metaphase where chromosomes were aligned at the center of the cell was observed in both the bright field and fluorescence images (Figure 1A). At this point, chromosomes were condensed, and fluorescence became more intense compared to the previous stage. Chromosomes that entered the later stage were separated into two sister chromatids and each one moved to opposite poles of the cell. And as shown in the last image, two daughter cells were finally generated in telophase. On the contrary, in the cells treated with nocodazole, the cell division process did not proceed any further as the chromatids could not be divided into both ends. In the bright field image, the cells continued to not adhere to the bottom anymore, and it was confirmed that the DNA was eventually fragmented, which resulted in apoptosis in the fluorescence image (Figure 1B).

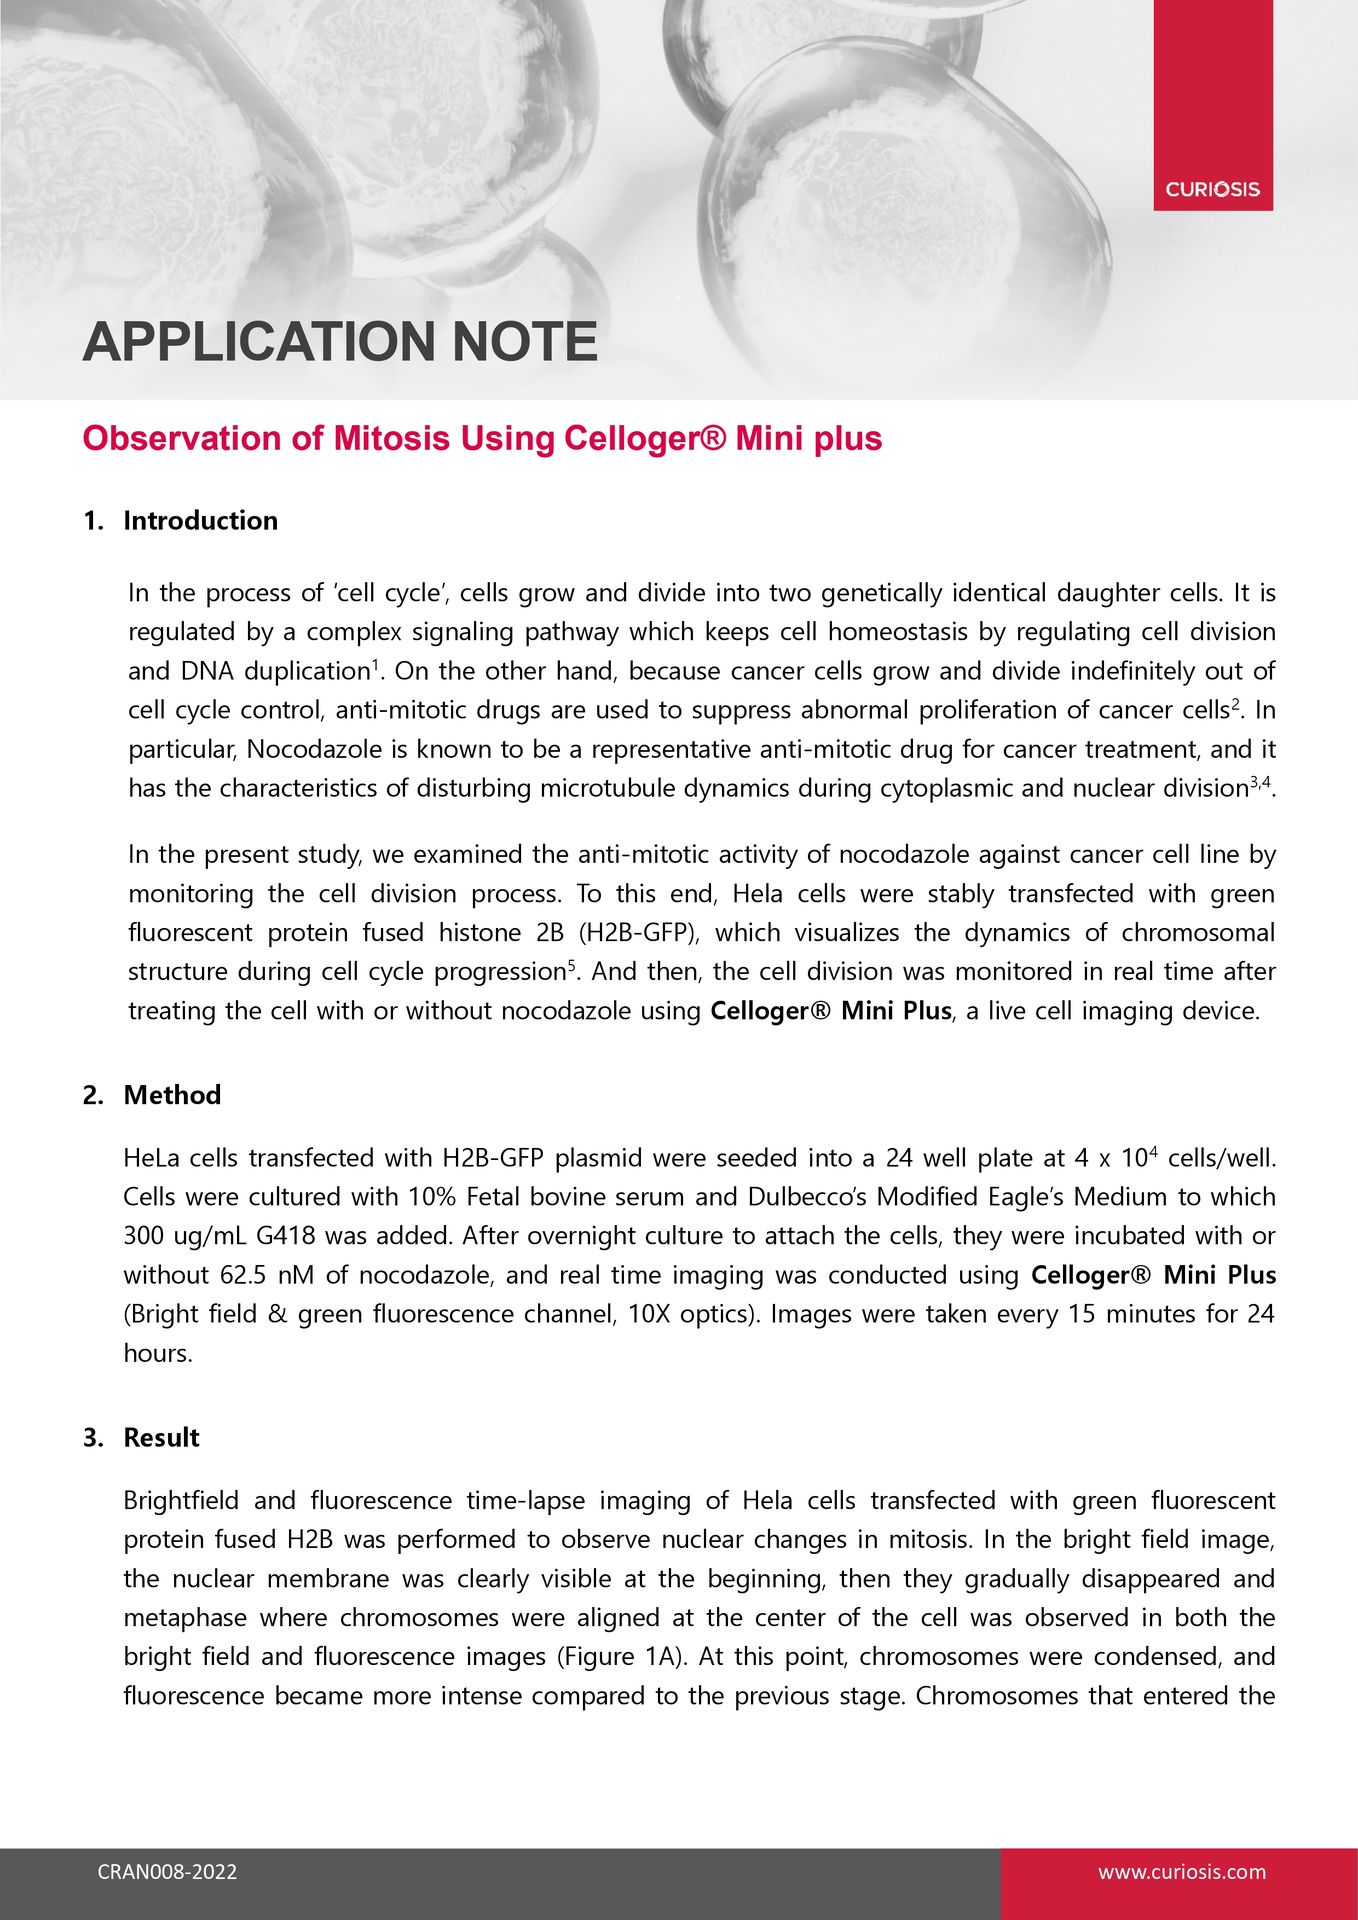
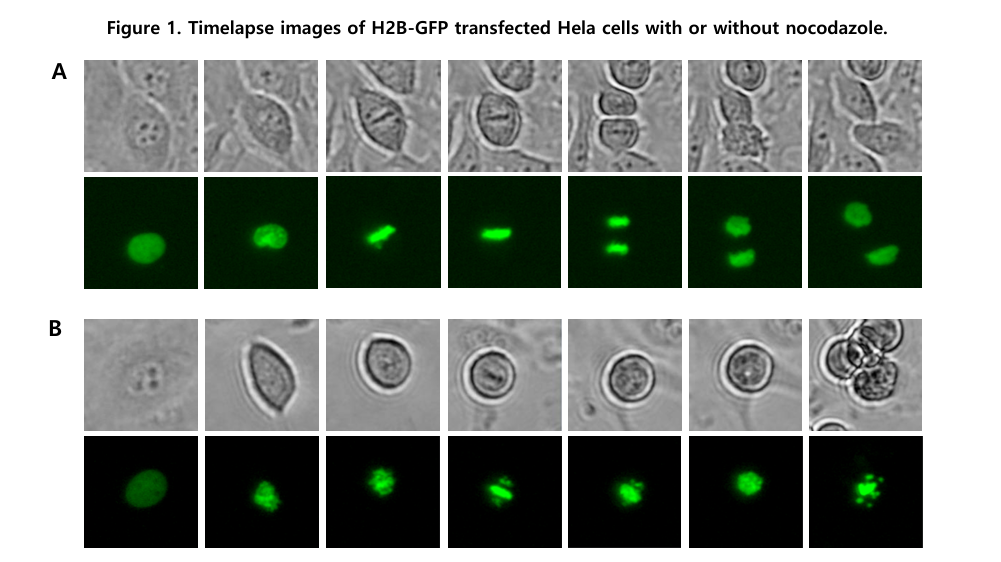
In each pane, upper images are brightfield images and lower images are fluorescence  images. Image J program was used for cropping and correction. 

(A) Control cells were not treated with nocodazole. 

(B) Cells were treated with 62.5 nM nocodazole.


Conclusion

Fluorescent labeling is a useful tool to observe the dynamics of organelles in live cells. So far, plasmids have been developed to observe various organelles or target protein using fluorescent fusion protein, and many studies have been conducted to verify the changes in organelles or protein translocation induced by various stimulations.

In this application note, we performed a nuclear labeling method using histone and green fluorescence fusion protein that binds to DNA. To confirm the effect of nocodazole on cell division, cells were monitored over time and images were acquired using Celloger® Mini Plus, a real-time live cell imaging device. The system has a fully motorized camera that enables imaging of various positions at a set interval programmed by the user. This makes it possible to track changes in each cell under different conditions.

Mitosis in live HeLa cells can be observed by stably transfecting the cells with H2B-GFP, which labels chromosomal DNA with green fluorescence. Using a live-cell imaging system such as the Celloger® Mini Plus, brightfield and fluorescence images can be captured at defined intervals. In this study, images were taken every 15 minutes over 24 hours to monitor cell cycle progression.

H2B-GFP is a fusion protein that binds to DNA, allowing direct visualization of chromosomal dynamics during the cell cycle. As chromosomes condense and align during mitosis, fluorescence intensity increases, making different mitotic stages easy to identify. This method enables detailed tracking of nuclear changes in live cells.

In this study, HeLa cells were treated with 62.5 nM nocodazole. This concentration effectively disrupted microtubule dynamics, preventing proper chromatid separation and halting mitotic progression.

Nocodazole disrupts microtubule dynamics, which are essential for chromosome segregation during mitosis. Treated cells failed to separate sister chromatids to opposite poles, resulting in mitotic arrest. Eventually, DNA fragmentation and apoptosis were observed in fluorescence images.  

The experiment used brightfield and green fluorescence channels with 10X optics on the Celloger® Mini Plus. Images were captured every 15 minutes for 24 hours. The system’s fully motorized camera allows automated imaging of multiple positions at user-defined intervals.

During early mitosis, the nuclear membrane gradually disappears, and chromosomes align at the cell center in metaphase. Chromosome condensation leads to increased fluorescence intensity. In later stages, sister chromatids separate and move to opposite poles, forming two daughter cells in telophase.  

Yes, the Celloger® Mini Plus features a fully motorized camera that enables imaging of multiple positions at programmed intervals. This allows researchers to track individual cells and compare different treatment conditions, such as control versus nocodazole exposure, in real time.

HeLa cells transfected with H2B-GFP were seeded at 4 × 10⁴ cells per well in a 24-well plate. Cells were cultured in DMEM supplemented with 10% fetal bovine serum and 300 µg/mL G418 before nocodazole treatment and imaging. 

This method supports evaluation of anti-mitotic drug activity by directly visualizing chromosome dynamics and cell cycle arrest. It can be used to assess drug-induced mitotic inhibition, chromatid segregation defects, and apoptosis. The approach is applicable to studies of cancer cell proliferation and cell cycle regulation.

Download the full Application Note PDF

to access the complete live-cell imaging workflow, including the H2B-GFP transfection protocol, time-lapse fluorescence imaging parameters, and quantitative analysis of nocodazole-induced mitotic arrest 

and chromosomal dynamics in HeLa cells using the Celloger® Mini Plus.


Analysis of Nocodazole-induced Cytotoxicity