Skip to Content

Real-time monitoring of intracellular Ca2+ dynamics in HEK293 cells

Application Note: Real-Time Imaging of Intracellular Ca2+ Dynamics in HEK293 Cells Using Celloger® Pro

This application note demonstrates a real-time imaging method for monitoring intracellular calcium (Ca²⁺) dynamics in HEK293 cells using Celloger® Pro from Yamato Scientific America. Intracellular Ca²⁺ plays a crucial role in cell signaling, yet capturing its rapid fluctuations remains a technical challenge. By employing GCaMP3, a genetically encoded calcium indicator, researchers visualized calcium transients in live HEK293 cells with high temporal precision. Stimulation with ATP and histamine revealed distinct signaling patterns, showing how Celloger’s live cell analysis platform can differentiate receptor-specific Ca²⁺ responses and quantify transient fluorescence changes (ΔF/F₀) in real time.

The study highlights how Celloger enables seamless, non-invasive live cell imaging and precise tracking of fast biochemical events without phototoxicity or complex setup. Results demonstrated that ATP triggered immediate calcium influx, while histamine produced slower intracellular signaling, confirming the system’s sensitivity for diverse biological assays.

Introduction - Intracellular Calcium Signaling

Introduction

Intracellular calcium (Ca2+) signaling plays a pivotal role in regulating diverse cellular processes, including neurotransmission, secretion, proliferation, and apoptosis.1 Monitoring these rapid and transient calcium dynamics in real time is essential for understanding signal transduction pathways and cellular responses to external stimuli.

To visualize such calcium fluxes, genetically encoded calcium indicators (GECIs) have emerged as powerful alternatives to traditional chemical dyes.2 Among them, GCaMP3—a fusion protein composed of circularly permuted green fluorescent protein (cpGFP), calmodulin (CaM), and the M13 peptide—undergoes a calcium-dependent conformational change that enhances fluorescence intensity.3 Compared to synthetic dyes, GCaMP3 offers improved sensitivity and compatibility, lower cytotoxicity, and suitability for long-term live-cell imaging.4,5

In this application note, HEK293 cells were selected as the model system because of their ease of culture, high transfection efficiency, and robust calcium signaling capacity.6 Although not excitable like neurons, HEK293 cells respond readily to chemical stimulation with measurable calcium transients, providing a practical platform for validating calcium imaging workflows. To induce calcium signaling, two well-characterized agonists were employed: ATP (purinergic receptor agonist) and histamine (H1 receptor agonist). By applying these stimuli to GCaMP3-expressing HEK293 cells, we demonstrate how Celloger® Pro enables real-time monitoring and analysis of distinct intracellular Ca2+ dynamics.

Materials and Methods

GCaMP3 Transfection

HEK293 cells were seeded in a 12-well plate at 1.5×10⁵ cells/well in Dulbecco’s Modified Eagle Medium (DMEM) supplemented with 10% fetal bovine serum (FBS) and 1% penicillin–streptomycin. GCaMP3 plasmid transfection was performed using Lipofectamine™ 3000 (Thermo Fisher Scientific, L3000001) in Opti-MEM™ (Thermo Fisher Scientific, 31985062) according to the manufacturer’s instructions. After 3 hours, the medium was replaced with fresh complete DMEM, and cells were incubated for an additional 24 hours. To enrich GCaMP3-expressing cells, G-418 (Merck, 108321-42-2, 500 µg/mL) selection was applied for 6 days with medium changes every 2-3 days. Following selection, cells were transferred to a 24-well plate and incubated overnight.

ATP/Histamine Stimulation and Imaging

Intracellular Ca2+ imaging with Celloger® Pro was performed at room temperature. Culture medium was removed, and cells were washed once with PBS to eliminate residual calcium. After mounting the plate on the device and adjusting the focus in the green fluorescence channel, either ATP (100 µM) or histamine (100 µM) was added manually as Preview Recording began. Each recording lasted approximately 1 minute and was analyzed using ImageJ. ROI-based measurements were performed frame by frame to quantify changes in green fluorescence intensity (ΔF/F0).

Results

The schematic in Figure 1A illustrates the overall experimental workflow and a graphical representation of the GCaMP3 activation mechanism. When chemical agonists bind to their cognate receptors, intracellular Ca2+ rises either by influx across the plasma membrane or by release from the endoplasmic reticulum (ER). Upon Ca2+ binding, GCaMP3 fluorescence increases, enabling real-time observation and recording of intracellular Ca2+ dynamics. Representative fluorescence images (Figure 1B) show Ca2+-dependent fluorescence changes in HEK293 cells following ATP treatment. Notably, ATP stimulation induced a sharp rise in fluorescence intensity at around 7 seconds, followed by a gradual decline by 30 seconds. In contrast, untreated cells exhibited a slow decrease in fluorescence over the same period, presumably due to photobleaching from continuous light exposure.

To further characterize stimulus-specific signaling patterns, intracellular Ca2+ responses were quantitatively compared under four conditions: unstimulated control (CTR), ATP, histamine, and ATP in Ca2+-free DPBS [ATP (-Ca2+)]. Histamine was included as a comparative agonist, whereas the ATP (-Ca2+) was used to assess responses in the absence of extracellular Ca2+. Normalized GCaMP3 fluorescence intensity was calculated using the following equation:


* Ft = fluorescence intensity at time t, F0 = baseline fluorescence intensity at 0 s.


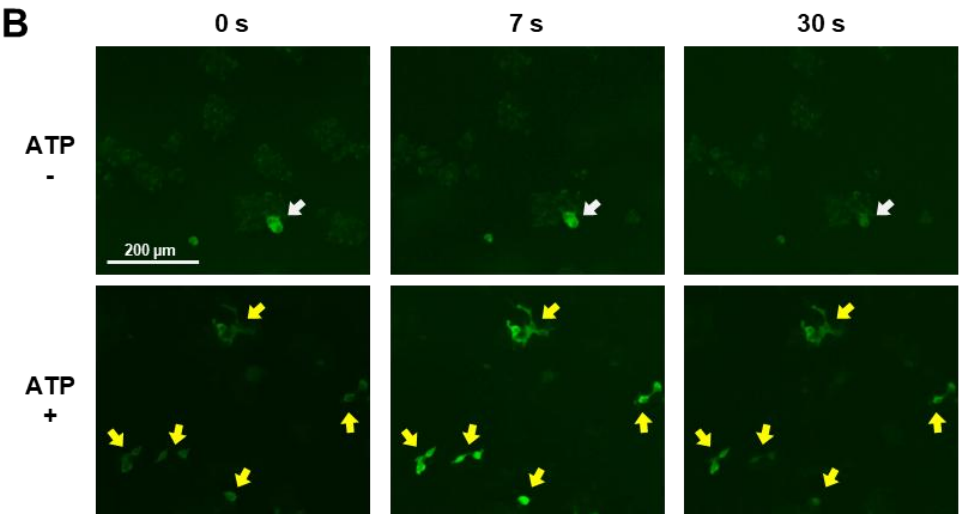
Figure 1. Real-time Ca2+ imaging of GCaMP3-expressing HEK293 cells during ATP stimulation

(A) Schematic of the experimental workflow. HEK293 cells were transfected with GCaMP3, a genetically encoded calcium indicator whose fluorescence increases upon Ca2+ binding. After incubation, cells were treated with ATP or histamine and monitored in real time with the Celloger® Pro system. The Preview Recording mode was initiated concurrently with agonist addition to capture rapid changes in intracellular Ca2+ levels. (B) Representative green fluorescence images showing responses to ATP (100 µM) at 0, 7, and 30 seconds after addition. White arrows indicate cells with no detectable change in fluorescence; yellow arrows indicate cells with distinct changes in fluorescence intensity. Scale bars: 200 µm.


Results Discussion

As shown in Figure 2A, ATP triggered a rapid and robust increase in GCaMP3 fluorescence, whereas histamine produced a slightly slower and less intense signal. In contrast, the control showed negligible changes over time. These differences were further supported by peak fluorescence intensity measurements (Figure 2B). The observed patterns reflect the underlying signaling mechanisms. ATP activates purinergic P2 receptors—P2X channels drive immediate Ca2+ influx, while P2Y receptors initiate IP3-dependent Ca2+ release—leading to rapid and robust signaling.7 In contrast, histamine primarily signals through Gq-coupled H1 receptors in HEK293 cells, eliciting slower IP3/Ca2+ signaling.8

Interestingly, ATP in Ca2+-free DPBS exhibited distinct kinetics; it showed significantly delayed and modest increase in fluorescence intensity (Figure 2A-C). Compared to ATP under normal Ca2+ conditions, the response was minimal, as expected due to the lack of extracellular Ca2+ influx. Nevertheless, fluorescence intensity remained slightly higher than in the control, suggesting that ATP may have triggered Ca2+ release via IP3-mediated signaling from the ER.9

Together, these results demonstrate that ATP and histamine activate distinct receptor pathways with different Ca2+ signaling profiles in HEK293 cells. The use of Ca2+-free buffer further highlights the contribution of intracellular Ca2+ stores.


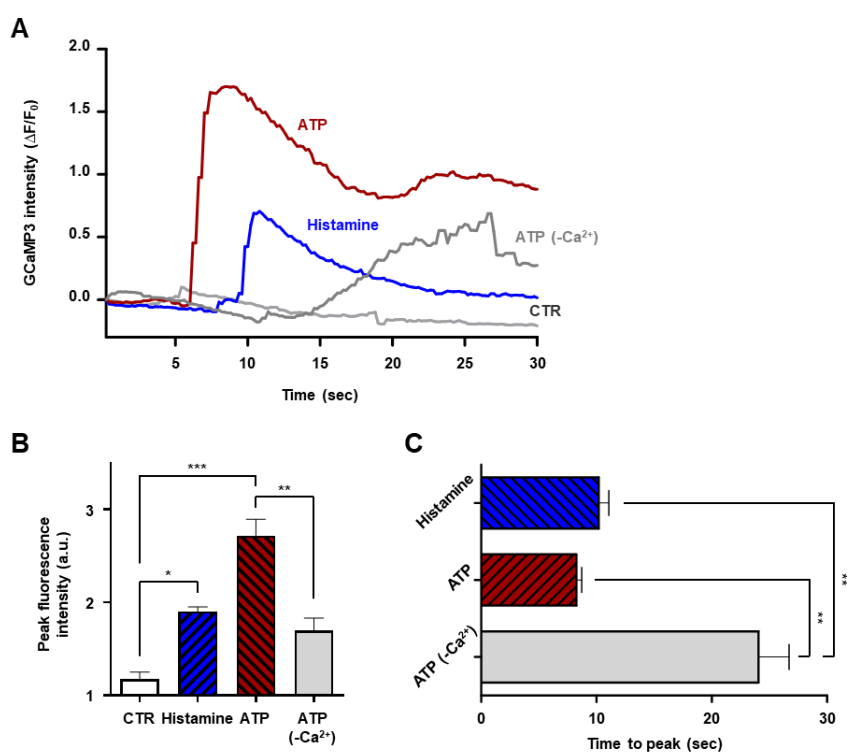
Figure 2. Quantitative analysis of intracellular Ca2+ responses

Intracellular Ca2+ responses were quantitatively analyzed under four conditions: unstimulated control (CTR), ATP, histamine, and ATP in Ca2+-free DPBS [ATP (-Ca2+)]. (A) Time-course plots show normalized fluorescence intensity (ΔF/F0) over the recording period. (B) Peak fluorescence intensity is presented for each condition (arbitrary units, a.u.). (C) Latency to maximum response is compared among ATP, histamine, and ATP(-Ca2+), while the control is excluded because no distinct peak is observed. Statistical significance is evaluated using one-way ANOVA followed by Tukey’s multiple-comparisons test (*p<0.05, **p<0.01, ***p<0.0001).


Conclusion

In this application, we employed GCaMP3-based Ca2+ imaging in HEK293 cells to investigate intracellular calcium signaling in response to chemical stimulation. The temporal patterns of cellular responses varied depending on the stimulant, with distinct differences in kinetics and peak intensities. Notably, ATP induced a measurable fluorescence increase even under Ca2+-free conditions, suggesting mobilization from intracellular stores.

Using Celloger® Pro, these rapid and transient Ca2+ responses were effectively monitored in real time. The system provides a seamless workflow for live-cell imaging and preview recording, enabling researchers to characterize stimulus-specific signaling dynamics with precision. Collectively, these findings underscore the importance of time-resolved Ca2+ imaging for accurate interpretation of intracellular signaling events at the single-cell level.

Monitoring intracellular Ca2+ dynamics in HEK293 cells helps researchers understand how calcium signaling regulates key cellular functions such as neurotransmission, secretion, proliferation, and apoptosis. Real-time imaging of Ca2+ fluctuations reveals how cells respond to chemical or environmental stimuli, making it essential for signal transduction studies.

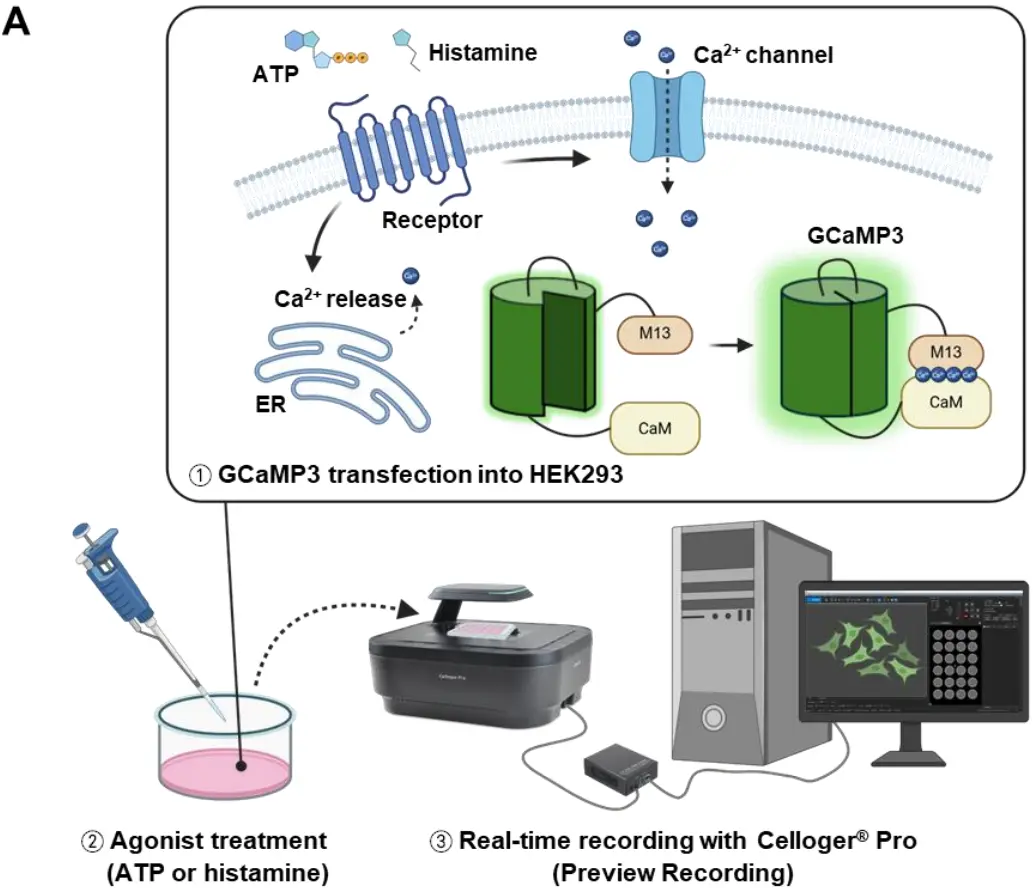
GCaMP3 is a genetically encoded calcium indicator composed of circularly permuted GFP, calmodulin, and the M13 peptide. When intracellular Ca2+ binds to GCaMP3, it triggers a conformational change that increases fluorescence intensity, allowing precise visualization of calcium fluxes in living cells.

Celloger® Pro provides seamless, non-invasive live-cell imaging with real-time fluorescence capture and precise temporal resolution. Its integrated software and optical system enable accurate measurement of rapid intracellular Ca2+ changes without phototoxicity or complex manual adjustments.

ATP and histamine were used to stimulate calcium signaling in HEK293 cells. ATP acts through purinergic P2 receptors to trigger rapid Ca2+ influx, while histamine activates H1 receptors to induce slower, IP3-mediated Ca2+ release from intracellular stores.

Each Celloger recording session lasted approximately one minute, capturing real-time calcium responses immediately following the addition of ATP or histamine. The short acquisition time allows high-resolution tracking of fast and transient Ca2+ signals.

ATP stimulation caused a sharp rise in fluorescence intensity within 7 seconds, followed by a decline at 30 seconds, indicating rapid Ca2+ influx. In contrast, histamine produced a slower, less intense response, reflecting differences in receptor-mediated signaling pathways.

Yes. The study showed that ATP still induced measurable fluorescence in Ca2+-free buffer, confirming that Celloger® Pro can detect calcium release from intracellular stores, such as the endoplasmic reticulum, via IP3-mediated signaling.

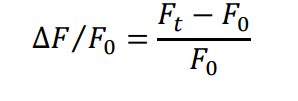
Fluorescence changes were quantified as ∆F/F₀, where Fₜ is fluorescence intensity at time t, and F₀ is the baseline intensity. This normalization method enables accurate comparison of calcium dynamics between control and stimulated cells.

HEK293 cells were selected due to their ease of culture, high transfection efficiency, and strong calcium signaling capability. Their consistent responsiveness to chemical agonists makes them ideal for validating calcium imaging protocols.

The Celloger-based imaging workflow can be applied to diverse cell types and signaling assays requiring real-time tracking of dynamic intracellular events. It is particularly useful for evaluating receptor activity, drug screening, and live-cell pathway analysis.

Download the full Application Note PDF

to gain comprehensive access to the data, including the detailed GCaMP3 transfection protocol, quantitative time-course plots, 

and statistical evaluation of Ca2+  responses in HEK293 cells using Celloger Pro.