Skip to Content

Real-time imaging and automated quantification of wound closure dynamics

Application Note: Real-Time Imaging and Automated Quantification of Wound Closure Dynamics with Celloger® Pro

This Application Note describes the use of real-time imaging and automated wound healing assays to quantify cell migration dynamics in NIH-3T3 fibroblast cells using the Celloger® Pro live-cell imaging system. Cell migration is a critical process in wound healing, tissue regeneration, and cancer research, yet traditional scratch assays often rely on manual imaging and subjective analysis, limiting reproducibility and throughput. To address this challenge, Yamato Scientific America highlights a standardized workflow combining automated time-lapse acquisition with objective image-based quantification using Celloger technology.

In this study, wound closure was monitored under varying fetal bovine serum (FBS) concentrations and following treatment with migration-modulating compounds, including staurosporine, cytochalasin B, and doxorubicin. Real-time imaging, live cell analysis, and automated wound area detection enabled precise measurement of closure kinetics over 72 hours, revealing clear, condition-dependent differences in migration behavior. Notably, the system distinguished between reduced migration, cytoskeletal inhibition, and compensatory spreading responses, demonstrating its value for interpreting complex phenotypes.

Overall, this application note demonstrates that Celloger® Pro delivers reproducible, high-resolution wound closure data with minimal user intervention, supporting robust cell migration and wound healing assays. Download the full application note to explore the detailed protocol, quantitative workflow, and comprehensive data set.


Introduction

Cell migration is a fundamental biological process involved in wound healing, tissue regeneration, and cancer metastasis. The wound healing assay, also known as the scratch assay, is widely used in vitro method to evaluate migratory capacity by monitoring how cells move to close an artificially created gap under different stimuli.

Accurately distinguishing differences in migration patterns across conditions is essential for understanding the regulatory mechanisms of cell movement and for evaluating the effects of potential therapeutic agents. For example, changes in growth factor availability (e.g., serum concentration) and drug-induced cytoskeletal modulation can significantly influence wound closure dynamics, making robust quantification essential to avoid misinterpretation of experimental outcomes. However, conventional approaches that rely on manual imaging and analysis can be time-consuming and often lack reproducibility, particularly when multiple conditions or subtle phenotype differences must be compared. Automated time-lapse imaging with standardized acquisition and analysis can help overcome these limitations by reducing user-dependent variability and enabling more reliable comparisons.

In this application note, the Celloger® Pro automated live-cell imaging system. was used to perform wound healing assays in real time under different experimental conditions, including varying fetal bovine serum (FBS) concentrations and treatment with migration-modulating drugs. The assays were quantified using Celloger® ’s latest image-based analysis algorithm to enable consistent, objective measurement of wound closure dynamics across conditions. Overall, this workflow demonstrates how automated time-lapse imaging combined with quantitative image-based analysis can simplify and accelerate migration assays while providing consistent results.


Materials and Methods

NIH-3T3 fibroblasts were cultured in Dulbecco’s Modified Eagle Medium (DMEM) supplemented with 10% FBS and 1% penicillin-streptomycin at 37°C. When cells reached approximately 90% confluence, a uniform linear scratch (wound) was generated at the center of each well using a sterile pipette tip. Immediately after scratching, wells were gently washed twice with phosphate-buffered saline (PBS) to remove detached cells and debris. Subsequently, cells were incubated in fresh DMEM supplemented with FBS at 0%, 5%, or 10%. For drug treatment experiments, cells were maintained in DMEM containing 10% FBS and treated with staurosporine (10 nM), cytochalasin B (1.2 µM), and doxorubicin (50 nM). Time-lapse imaging was performed every 30 minutes for 72 hours. Wound area was quantified from bright-field (BF) images using the Celloger Analysis App.


Results

Wound closure rate was used as an indicator of cellular motility and recovery capacity under different experimental conditions. The Celloger Analysis App provides multiple modes tailored to different cellular structures and experimental purposes. In Wound Area mode, the software distinguishes the scratched region from cell-covered areas and displays the detected wound area as a yellow overlay (Figure 1). Wound area was measured at each time point using a high-accuracy analysis algorithm, and wound closure rate (%) was calculated as follows:

* At=0h = area of the wound measured immediately after scratching (t = 0 h)
* At=Δh = area of the wound measured h hours after the scratch is performed

To begin with, temporal changes in wound closure (%) under different FBS concentrations (0%, 5%, and 10%) were compared (Figure 2). With identical initial wound areas, wound closure was delayed in the 0% FBS condition, indicating reduced recovery capacity. In contrast, wound closure progressed rapidly in the 10% FBS condition, consistent with enhanced cell migration and proliferation (Figure 2A). The 5% FBS condition also showed closure, but at a slower rate than the 10% FBS condition. Quantitative analysis confirmed that the 10% FBS condition exhibited the steepest increase over time, whereas the 0% FBS condition showed only a slight change, highlighting that growth factor content in the medium significantly affects cell motility and wound closure dynamics (Figure 2B).

In addition to serum conditions, wound closure can be influenced by cell migration, proliferation, and cell death. To examine how perturbing these processes alters closure kinetics, additional wound-healing assays were performed with staurosporine, cytochalasin B, and doxorubicin at sublethal concentrations.

In representative images (Figure 3A), the 10% FBS control condition showed robust wound closure. In contrast, staurosporine, a potent apoptosis inducer2 , markedly reduced wound-healing activity. Cells displayed progressive morphological changes, including shrinkage, consistent with apoptosis (Figure 3A-B). Cell death became evident around 20 hours, causing the wound closure curve to plateau, with little to no further closure observed thereafter (Figure 3C).

Cytochalasin B also markedly reduced wound closure. Because cytochalasin B disrupts actin polymerization and impairs the cytoskeletal dynamics required for motility3 , this effect is consistent with reduced migratory capacity. No evident cell death was observed, but proliferation appeared suppressed (Figure 3B), limiting advancement of the leading edge and slowing closure (Figure 3C).

Interestingly, doxorubicin produced a wound closure rate similar to the control. As a chemotherapeutic agent that induces DNA damage4 , doxorubicin did not cause pronounced cell death under the conditions tested but appeared to suppress cell proliferation. Despite this growth inhibition, wound closure remained comparable to the control because cells showed extensive spreading while maintaining migratory activity. This suggests that suppressing proliferation alone may not be sufficient to reduce wound closure and that effective inhibition requires direct impairment of migration. Notably, under mild cytotoxic stress, doxorubicin may promote a compensatory response in which cells increase their footprint and continue collective migration despite reduced growth5 . These results demonstrate that wound closure curves vary markedly depending on the drug applied and can be categorized into distinct patterns (e.g., steep upward, gradual upward, or flat) based on their trends.

Taken together, these findings highlight the value of live-cell imaging for interpreting wound closure dynamics, as migration- and proliferation-associated behaviors can contribute differently depending on the condition or treatment. Distinguishing the relative contributions of these processes enables more accurate assessment of wound-healing activity and provides clearer insight into how external stimuli modulate collective cell behavior.


Conclusion

This application note highlights the effectiveness of the Celloger® Pro system for wound-healing assays. Using NIH-3T3 cells, the system clearly detected differences in wound closure rates across FBS concentrations and enabled classification of distinct drug-induced closure patterns. By automating both image acquisition and wound area quantification, the system enables high-resolution, time-dependent monitoring of wound closure with minimal manual intervention.

Notably, the advanced wound detection algorithm provides accurate and consistent segmentation of the wound region, even in low-contrast or partially closed gaps. This improvement enhances the reliability of quantitative analysis and reduces user-dependent variability. Overall, the ability to clearly distinguish wound closure responses under different conditions underscores the value of Celloger® Pro as a powerful all-in-one solution for regenerative medicine research and cell motility studies.

A wound healing assay is used to evaluate cell migration by measuring how cells move to close an artificially created gap over time. It is commonly applied to study wound repair, tissue regeneration, and mechanisms related to cancer metastasis. 

Celloger® Pro performs automated bright-field time-lapse imaging directly inside the incubator, capturing images every 30 minutes for up to 72 hours. This enables continuous, real-time monitoring of wound closure without disturbing cell culture conditions.  

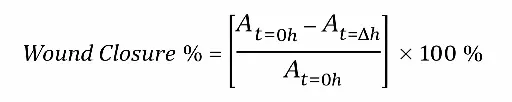
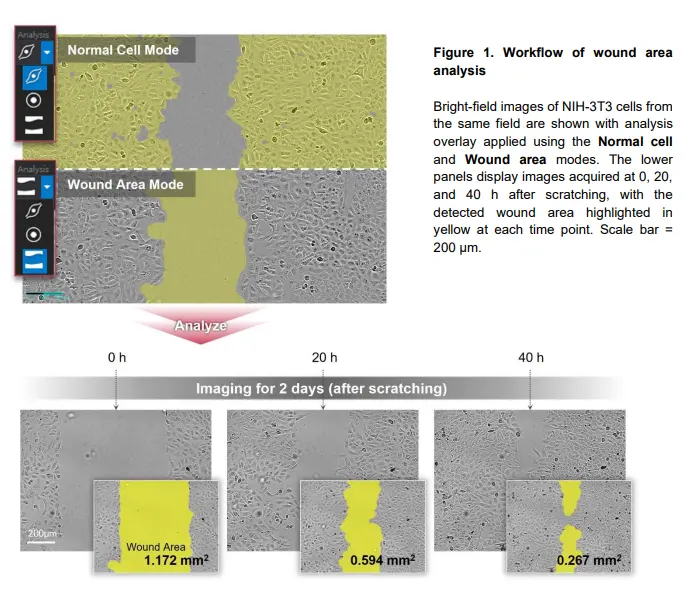
Wound closure is quantified by measuring the wound area at each time point and calculating the percentage reduction relative to the initial wound area. The Celloger Analysis App uses an image-based algorithm to automatically segment the wound region and compute closure rates.  

In this application note, wound healing assays were monitored for 72 hours with images acquired every 30 minutes. This duration allows both early and late-stage wound closure dynamics to be captured.

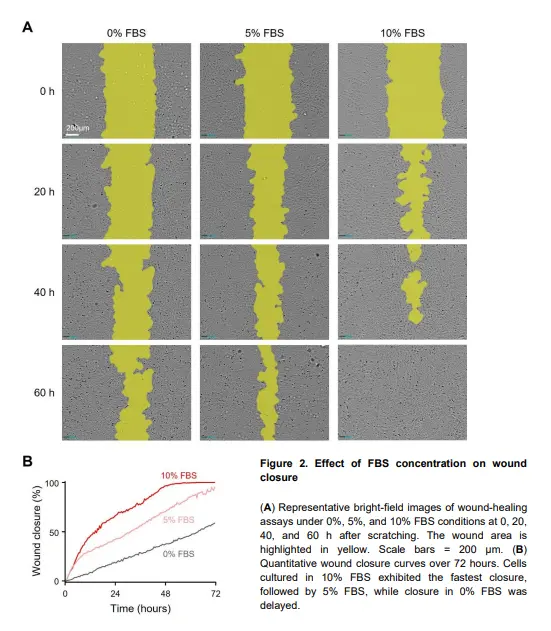
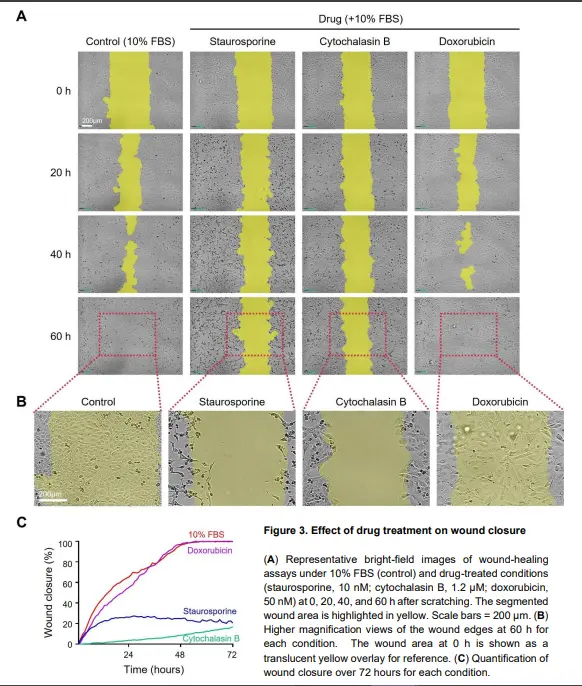
Higher FBS concentrations accelerate wound closure by enhancing cell migration and proliferation. Cells cultured in 10% FBS showed the fastest closure, while 0% FBS resulted in delayed and minimal wound recovery.  

  NIH-3T3 mouse fibroblasts were used in this study. These cells are widely used in migration and wound healing assays due to their robust and reproducible motility behavior.

Migration-modulating drugs produced distinct wound closure patterns depending on their biological effects. Staurosporine halted closure due to apoptosis, cytochalasin B reduced closure by disrupting actin dynamics, and doxorubicin maintained closure despite suppressed proliferation.  

  Celloger® Pro automates image acquisition and wound area analysis, reducing user-dependent variability and improving reproducibility. It also enables standardized, long-term time-lapse imaging across multiple experimental conditions.

Yes, the advanced wound detection algorithm provides accurate and consistent segmentation even in low-contrast or partially closed wound regions. This improves the reliability of quantitative analysis throughout the assay.  

These assays are useful for regenerative medicine, cancer research, and cell motility studies. Celloger enables clear comparison of migration responses to serum conditions and drug treatments with minimal manual intervention.   

Download the full Application Note PDF

to gain comprehensive insight into the automated wound healing assay workflow, including real-time Celloger® Pro imaging, quantitative wound closure kinetics, and comparative analysis of cell migration under varying serum conditions and migration-modulating compounds in NIH-3T3 fibroblasts.


Real-time monitoring of intracellular Ca2+ dynamics in HEK293 cells